EU LNG Terminals in Figures: Import Capacities Still Underutilized
Just like in past years, Food & Water Action Europe has taken a closer look at the utilization rates of terminals to import liquefied fossil gas (LNG) in the EU and the UK.
With 2019 being a veritable boom year for LNG imports, the average utilization rate is up, but still nowhere near full capacity. While the COVID-19 pandemic and other factors have made it more difficult to estimate future trends, it is clear that the EU still has plans to expand import capacities. This would be a terrible decision, since there is clearly no justification to waste even more money on unneeded fossil fuel infrastructure.
Since 2012, EU & UK have imported approximately 555 billion cubic meters of dirty LNG* via 22 large-scale LNG terminals. On average, these facilities were used at less than one third (29%) of their full capacity. Yet, due to several geopolitical and market reasons, the EU and UK substantially increased their LNG imports in 2019 and 2020, reaching an average utilisation rate of 46%.
Read more details in our blog Europe’s Liquid Fossil Gas Dream: Costly, Inefficient and Harmful.
The amount of unused capacity varies from country to country. Looking at the past few years, both Portugal and Italy, followed by Poland, show the least idle capacity, while the UK, Greece, Spain and Belgium seem to be champions of almost-empty LNG terminals (see Figure 1).
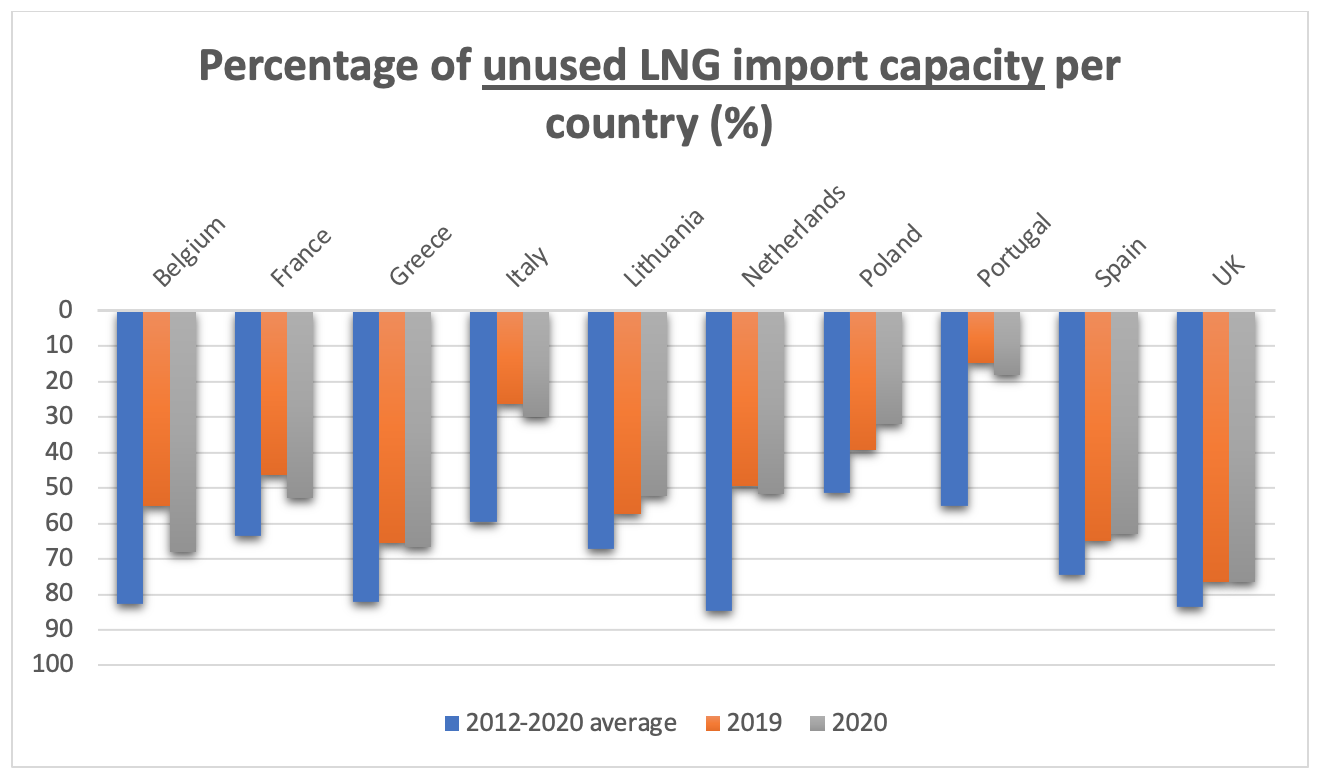 Figure 1
Figure 2 shows that almost all EU & UK terminals imported significantly more LNG in the past 2 years than they had imported on average since 2012. Close to 40% (37,5%) of the total amount of LNG imported since 2012 was delivered in these two years (2019 and 2020). Nevertheless, even during the boom years, the average utilization of a majority of the terminals remained at less than 50%. Also, within countries with several import terminals (e.g. Spain, France, UK, Italy), utilization rates of respective LNG terminals can vary greatly.
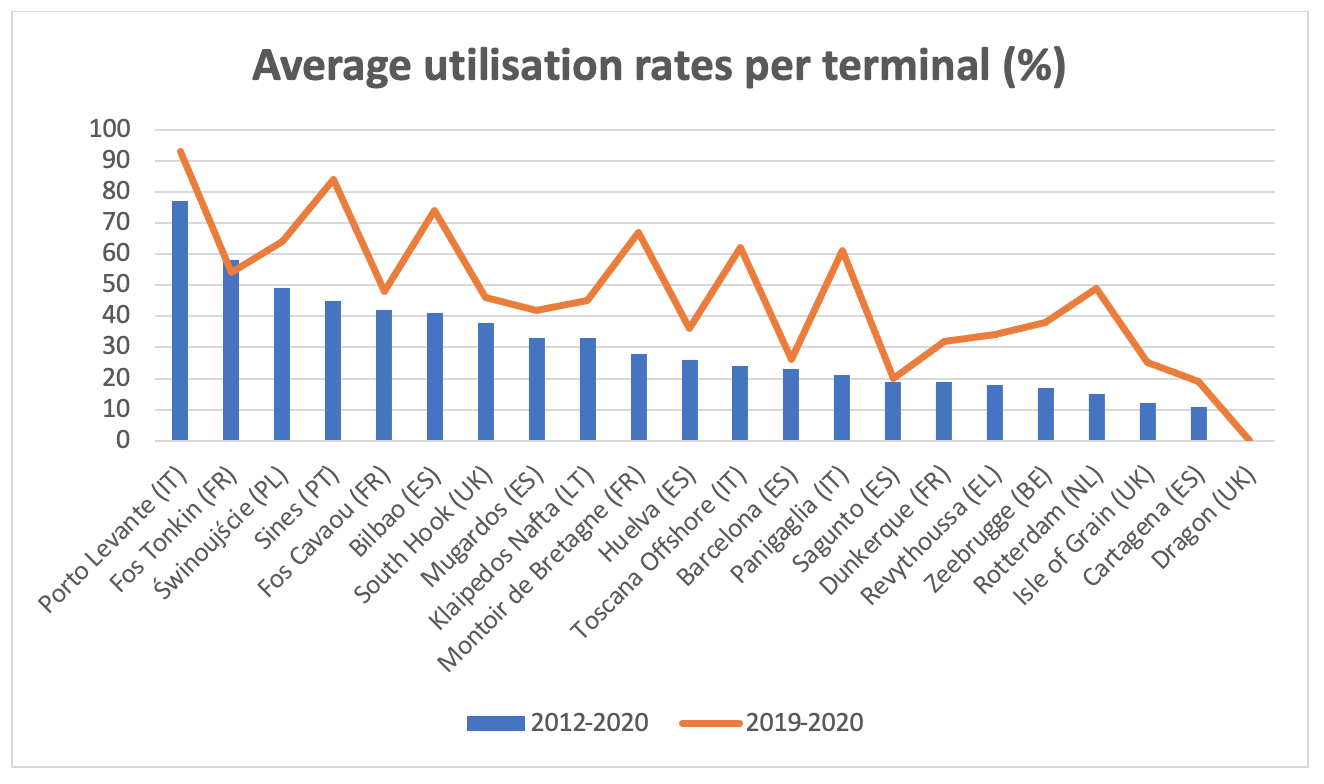 Figure 2
While 10 countries in the EU27+UK import LNG, just three of them (Spain (25%), France (21%) and the UK (18%)) account for nearly two thirds (64%) of all LNG entering the bloc, followed by Italy (14%), Portugal and Poland (both 5%) and Belgium and the Netherlands (both 4%).
Germany, the EU’s #1 fossil gas consumer, however, has no LNG terminals and is thus not included in the calculation.
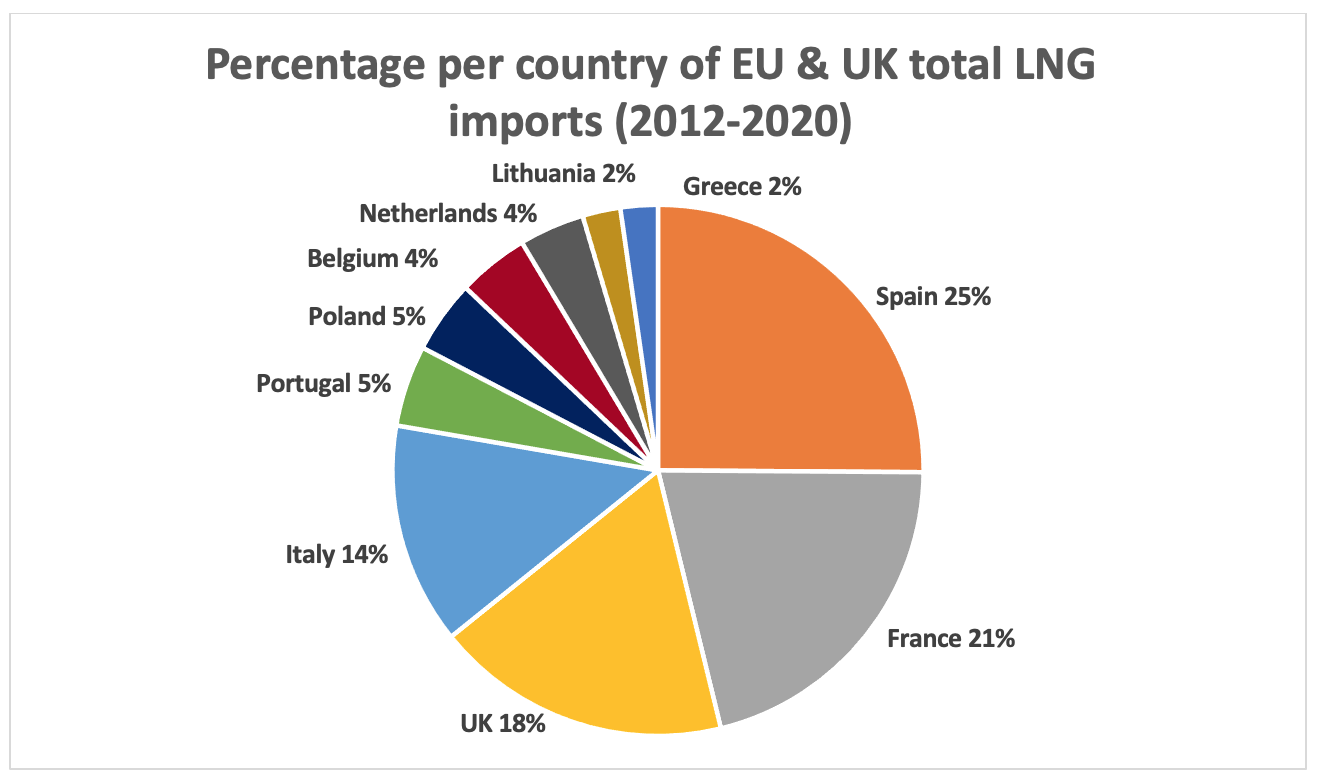 Figure 3
Since 2017, more and more of this LNG is actually coming from the United States, and a majority of the latter is fracked. In its gas market report, the EU Commission calculated the cumulative monthly LNG imports from the US that entered the EU – see Figure 4. Spain is the sad number one, with volumes of cumulative dirty US LNG imports higher than any other EU member state, followed by France, Italy and the Netherlands.
Also the UK became one of the most important takers of dirty US LNG in the past years.
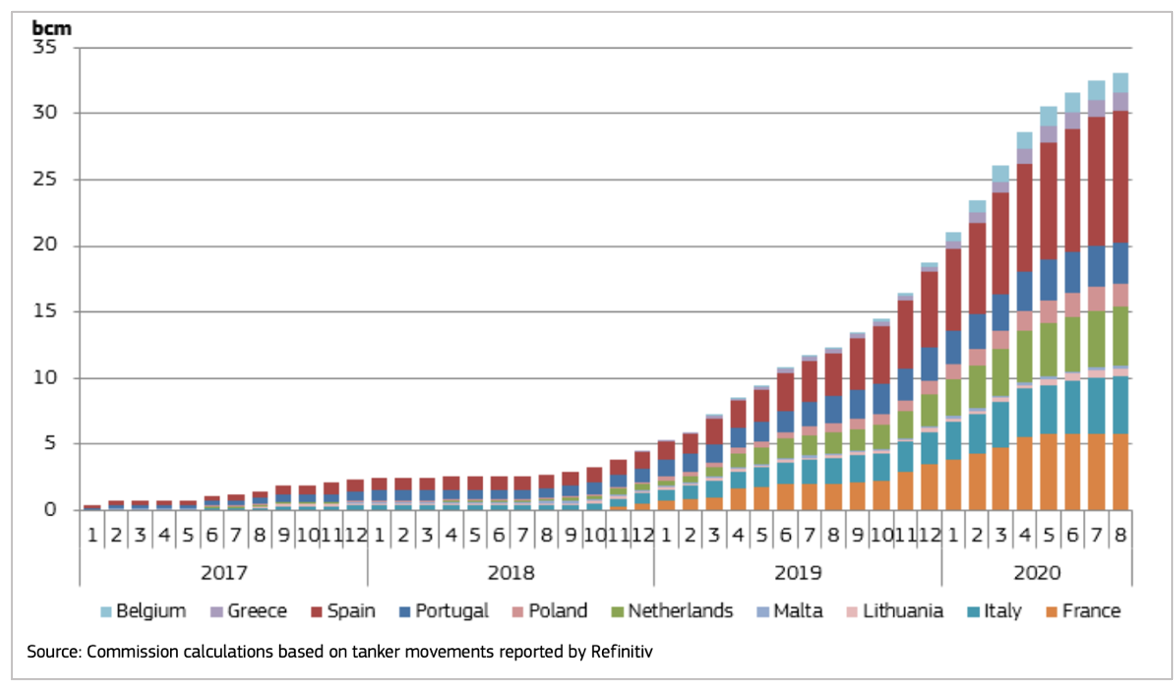 Figure 4 – Cumulative monthly LNG imports from the US in the EU
__
* Corresponding to the ~5423317 GWh of aggregated gas flow sent out of the LNG facilities. When we talk about LNG imports in this article, we do not include LNG storage. All calculations are based on figures from alsi.gie.eu (last update: 07/12/2020).